This application note demonstrates an LC-FLR-MS based workflow using an MS enabled spectral library matching algorithm to improve productivity and confidence of glycan profiling. It demonstrates the application of the MS Spectral Library functionality within Empower for analysis of RFMS labeled glycans.
Glycosylation is one of the most common and complex post-translational modifications of monoclonal antibodies (mAbs). Due to its direct correlation to drug efficacy, glycosylation has been recognized as a critical quality attribute (CQA) of mAb-based therapeutics.1 To ensure product safety and efficacy, biopharmaceutical companies invest a significant amount of resource in the selection and control of cell line glycosylation profiles. As biotherapeutic pipelines continue to expand, deploying methods that can assess glycosylation profiles accurately and consistently become increasingly important for efficient product development and quality control. As an orthogonal detection technique to LC-UV or LC-fluorescence (FLR), MS detection is being increasingly adopted in process development and manufacturing environments, offering an opportunity to improve confidence and productivity in the assessment of product quality attributes throughout the product life cycle.
The ACQUITY QDa Mass Detector requires minimal maintenance and can be readily adapted to existing LC-UV or LC-FLR workflows as a fit-for-purpose detector to address the changing needs of the biopharmaceutical industry.2 In this study we will demonstrate an LC-FLR-MS based workflow using an MS enabled spectral library matching algorithm to improve productivity and confidence of glycan profiling. As a proof of concept, a library will be created using RapiFluor-MS (RFMS) labeled glycan standard and then used to address challenging glycan analyses in process development.
RapifFuor-MS labeled glycan standard was diluted in 40 µL 9/10/21 Water/DMF/ACN solvent with 2 µL injected for creating the library. N-glycans from mAb standard were released and labeled using the GlycoWorks RapiFluor-MS N-Glycan Kit (p/n 176004082).3 A volume of 10 µL sample was injected for each analysis.
|
LC system: |
ACQUITY UPLC H-Class Bio |
|
Detectors: |
ACQUITY FLR, λexcitation = 265 nm, λemission = 425 nm ACQUITY QDa (performance model) |
|
LC column: |
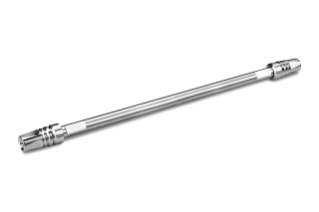
ACQUITY UPLC Glycan BEH Amide 130 Å, 1.7 μm, 2.1 x 150 mm |
|
Column temp.: |
60 °C |
|
Sample vial: |
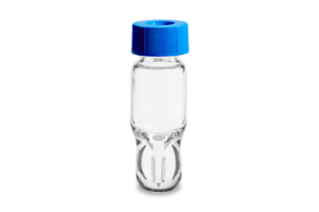
12 x 32 mm glass vial, total recovery (p/n 600000750cv) |
|
Mobile phase A: |
H2O, 50 mM Ammonium formate, pH = 4.4 |
|
Mobile phase B: |
Acetonitrile |
|
Informatics: |
Empower 3, Feature Release 4 |
|
Time (min) |
Flow rate (min) |
%A |
%B |
|
|---|---|---|---|---|
|
Initial |
0.400 |
25.0 |
75.0 |
|
|
35.00 |
0.400 |
46.0 |
54.0 |
|
|
36.50 |
0.200 |
100.0 |
0.0 |
|
|
39.50 |
0.200 |
100.0 |
0.0 |
|
|
43.10 |
0.200 |
25.0 |
75.0 |
|
|
47.60 |
0.400 |
25.0 |
75.0 |
|
|
55.00 |
0.400 |
25.0 |
75.0 |
|
Mass range: |
500–1250 m/z |
|
Mode: |
ESI+ |
|
Collection mode: |
Centroid |
|
Sample rate: |
2 points/sec |
|
Cone voltage: |
15 V |
|
Probe temp.: |
400 °C |
|
Capillary voltage: |
1.5 kV |
Integration of MS with LC-UV or LC-FLR workflows allows analysts to access MS spectral information that can be used to expedite process development and manufacturing workflows. In the case of the former, MS spectral libraries, as a repository of 3D MS spectral data, can be used as a spectral “fingerprint” for automated glycan identification or confirmation (Figure 1).
In practice, a spectral library is created using LC-MS data of pre-characterized glycan standard(s) or reference material. To demonstrate the benefits of a spectral library enhanced glycan workflow within Empower, the RapiFluor-MS labeled Glycan Performance Test Standard was used as a surrogate model of pure standard to create a library. As shown in Figure 2, 18 peaks were separated and integrated using a 55 minute method. The library functionality within Empower offers the flexibility of adding the MS spectra, along with an identifying label, to pre-existing libraries or to newly created libraries using the “Library” pull-down menu as shown in Figure 2. In addition to being flexible, once created, libraries are universal within the Empower CDS allowing library access to all projects for spectral matching of unknown glycan samples.
As an integrated function of the processing method, multiple parameters such as Noise Threshold and Retention Time Pre-search (Figure 3A) are available in the MS Library Search tab for method optimization. The Retention Time Pre-search filter is of particular use when the sample and library are separated using the same conditions as in the case of platform or screening methods. In this instance the Retention Time Pre-search restricts the spectral search within a RT window around the target peak for increased spectral matching accuracy. This can be beneficial when dealing with challenging MS spectra associated with isomers or in source fragmentations. In addition to offering multiple processing parameters for flexible method development, the MS Library Search tab also supports the use of multiple libraries during the matching process. This allows users to create discreet libraries under different conditions, an ideal scenario when dealing with multiple product lines with unique separation conditions or legacy methods that can’t be readily altered. Once optimized, the spectral library enhanced workflow can be used for putative identity or confirmation of glycan peaks as shown in Figure 3. In this example a spectral library based on the RFMS glycan standard was used with a 2% retention time filter and a noise threshold of 10% (Figure 3A) to confirm the identity of released N-glycans from the Waters mAb standard (Figure 3B) that were labeled with RapiFluor-MS. As shown in Figure 3C, the best match based on the spectral profile is listed in the “MS Match 1 Spect. Name” column in Peak Result table.
Developing control strategies of glycosylation profiles during the process development phase generally entails evaluating a significant number of parameters to determine optimal conditions with minimal risk. Unknown or new peaks that appear during this phase often reflect process changes and require identification to assess their impact on product quality and safety. In this study, we demonstrate how a spectral library enhanced workflow can be used to expedite the identification process. Representative chromatograms for the reference material and a process development sample acquired with the same platform method are shown in Figure 4A. In this example, two additional peaks were observed in the glycan sample compared to the reference material. With MS data acquired on the ACQUITY QDa, the spectral library was used to provide putative identification of the new peaks. As shown in the results table of Figure 4B, the two blank spaces for Peak 1 and Peak 4 in the “Name” column, which represent the unknown peaks, were tentatively assigned as FA1 and Man5 within the “MS Match1 Spect. Name” column. Cross-referencing the spectral match with the calculated Glucose Unit (GU) as shown in the table provides orthogonal information that can be used to increase confidence in peak assignment and streamline investigations into process deviations. To this end, incorporation of spectral library enhanced workflows offers the means to readily assess and respond to process changes that can potentially impact product safety and efficacy.
Empower is equipped with the ability to generate reports to simplify the review, sharing, and filing of acquired data. As part of the workflow, spectral matching data can be reported along with other data processing results in an automated fashion. To demonstrate the reporting function of Empower, a report was generated for the library searching results previously shown in Figure 4 using a pre-existing template. As shown in Figure 6, the report was formatted to display Sample Information, Fluorescence Chromatogram, and Peak Results table. All results can be customized to include desired information to meet different laboratory requirements.
In addition to new peaks, co-elution can also occur in glycan separation and impact the quantitation accuracy as it may be misinterpreted as a pure peak in an FLR chromatogram. In Empower, potential co-elutions can be investigated via the Purity View in the Mass Analysis window or in a semi-automated fashion using the spectral library functionality. The MS spectral library functionality within Empower offers the ability to report the best three matches of one MS spectrum via an iterative spectral search algorithm. As shown in the zoom-in chromatograms in Figure 5A, the FLR peak appears to be a single species and was assigned as Man5 in the “Name” column (Figure 5B) based on the retention time. However, MS spectra showed that there might be two species of glycans present within the peak (Figure 5A MS inset). Using the iterative search function the spectral library was able to identify two species within the single peak. As shown in Figure 5B, the dominant peak was identified in the first match as Man5 while the less abundant peak was detected and identified in the second match as FA1G1, indicating a co-elution occurred. In this aspect MS spectral library improves the product knowledge and assay confidence that can benefit glycan profiling in process development or screening workflows.
In conclusion, this work demonstrated the application of the MS Spectral Library functionality within Empower for analysis of RFMS labeled glycans. In combination with the ACQUITY QDa mass detector, MS spectral library enhanced workflows can be readily deployed to assist in the identification of unknown peaks and co-elutions for increased confidence and productivity in data interpretation of released N-Glycan analyses. With the reporting capability of Empower, the workflow can be completed in an automated manner and is ideal for released glycan analysis in process development.


720006503, January 2019